Critical Section Performance in r2.04
K.S. Bhaskar
TL;DR
Efficient access to critical sections is perhaps the single most important factor in determining database performance in high contention environments like large production systems. In our development of r2.04, we are paying a lot of attention to critical section access. This is a summary of our work and results to date (r2.04 is still under development as of this post’s publication date).
This post comes with the caveat that critical sections are only one determinant of application throughput. Other factors like compute time, or user input time may well be more important to your application. Even within an application, workloads vary: for example, the workload of interest posting in a bank is different from the workload of processing customer transactions.
What are Critical Sections?
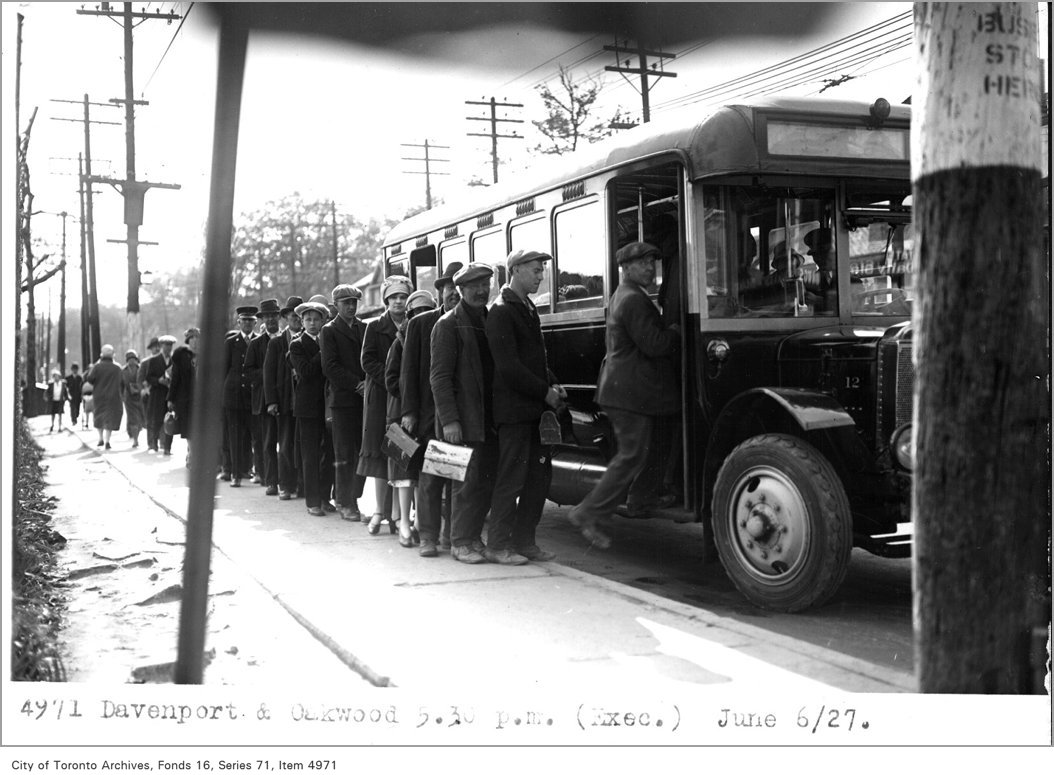
Imagine a bus where just one person can board at a time. How fast one can load the bus depends on how long it takes each person to board the bus, and how long it takes between people boarding. Space taken by people waiting to board the bus can also be a consideration when space is limited, such as inside a bus terminal.
If there are only a few people waiting to board, no special organization is needed. They can cluster round the door, and as soon as one person boards, another can follow. But if there are more than a few, it will be more efficient overall if they queue, as shown in the picture above, rather than cluster around the door. If there are many more people wanting to board the bus, it would be best to have barriers to organize the queue. Barriers are especially important to keep queues organized if space is limited.
Contrast the case of people boarding a bus with patients consulting a doctor. Both are “one at a time” activities, in the sense that one person boards the bus at a time. and the doctor sees one patient at a time. But the strategies for organizing access are different. Since the time that it takes to board a bus is short, it makes sense for those waiting to board to stand outside the bus. Since the time a doctor spends with a patient is longer, one usually makes an appointment. In some intermediate scenarios like waiting to be served at a counter, one might take a ticket and wait for its number to be called. You don’t make an appointment to board a bus, and in most countries you don’t line up outside the doctor’s office.
A critical section in software is like the door of the bus. It is a section of code that only one process at a time can execute. Contention occurs when multiple processes all need to execute a critical section, like many people wanting to board the bus. In the course of r2.04, we invested heavily in analyzing and optimizing code, especially code that executes in critical sections. That is not discussed here; this blog post is about handling critical section contention.
Access to Critical Sections
Access to critical sections is conceptually like people boarding a bus.
If there are a small number of processes contending for access to a critical section, like a small number of people clustering around the bus door, it is probably most efficient for each process to just “spin” in a tight loop, and keep trying to get the critical section. This is efficient because there is no overhead, and as soon as the critical section becomes available, a waiting process will get it. The disadvantage of this approach is that a spinning process consumes a CPU. Since a computer has a limited number of CPUs, having more than a few spinning processes prevents processes that don’t need the critical section from doing useful work.
If there are many processes contending for access to a critical section, it makes sense for them to queue. As with people queuing for a bus, this can be a simple queue where the processes organize themselves into a queue, or a queue with barriers that requires the action of an external agent (e.g., someone to erect the barriers).
While this spin-and-queue approach is conceptually simple, the devil is in the details.
Implementing Critical Sections
GT.M / YottaDB
For many years, the upstream GT.M included its own code to control access to critical sections that YottaDB used unchanged. This implementation is as follows.
- Spinning is like people clustering around the bus door.
- When a process is unable to get a critical section, it “hard spins” for a certain number of iterations, called the hard spin count, iterating in a tight loop to get the critical section. The r2.04 code base includes a PAUSE opcode to reduce the impact of its hard spin loops.
- After the hard spin limit is reached, it “soft spins” for a certain number of iterations called the soft spin count. The difference between a hard spin and a soft spin is that in the latter the process executes a sched_yield() each time through the loop. This relinquishes the CPU, and moves the process to the back of the run queue. When it reaches the front and gets the CPU, it again tries to acquire the critical section. It tries soft spins for soft spin count iterations. An important difference between a hard spin and a soft spin is that the sched_yield() of each iteration of a soft spin causes a context switch. Context switches use operating system resources, and may involve critical sections within an operating system.
- Queuing is like people waiting in line. When a process does not get the critical section after its hard spins and soft spins it adds itself to a queue in shared memory. Adding itself to this queue itself requires a critical section, albeit a tiny one that executes almost instantly and does not require any special organization. When a process releases a critical section, it wakes up the first process in the queue, which then tries to get the critical section. If it does not get the critical section, it goes through the hard-spins and soft spins and queuing all over again.
Owing to the number of changes we made to the builtin implementation and its evident abandonment by GT.M, we refer to it as the “YottaDB mutex.”
Linux
Linux provides pthread_mutex functions that use a similar technique.
Fairness vs. Throughput
Neither mutex implementation is “fair.” A process that reaches the front of the queue could again be pushed to the back of the queue by another process that just started its attempt to acquire the critical section (called “barging,” it is not unlike a queue-jumper that walks up to the door of the bus and gets in, pretending not to see the queue).
Fairness isn’t free. Implementing a guaranteed first-in / first-out fairness would be computationally expensive to the point of being unacceptable for a high-throughput application. Practical code to handle contention balances fairness against throughput.
While spin-and-queue techniques work well across most workloads of typical applications, their unfairness can be exacerbated when a system is pushed to its limits, resulting in large numbers of processes contending for the same critical section. While some processes randomly execute faster, others equally randomly execute slower, i.e., under heavy loads, the unfairness can manifest itself as inconsistent response times and throughput, rather than a proportional slowdown of all processes.
From r1.24 (V6.3-006) to r1.26 (V6.3-007)
GT.M versions through V6.3-006 used the builtin implementation of critical sections, as did YottaDB releases through r1.24. GT.M versions starting with V6.3-007 use pthread_mutexes, as do YottaDB releases from r1.26 through r2.02. While we do not know the motivation for the GT.M change, the developers would have had a reason to make the change.
The r2.04 Critical Section Journey
While no customer or user of YottaDB had expressed any concerns about performance, and although each YottaDB release was slightly faster than the GT.M versions merged into its code base (owing to small performance enhancements we have made that the upstream developers have not adopted), we decided to make performance and scalability a key feature of r2.04.
The Journey Begins
The twin axioms of performance improvement are:
- Be careful what you measure, because that is what you will improve.
- If you choose well, you will improve performance overall.
We decided to start with an M program that computes lengths of 3n+1 sequences, since that is a database update intensive workload that can easily be scaled up and down in both problem size as well as the number of concurrent processes. Running the program with twice the number of concurrent processes as CPUs (i.e., with some contention, but not a heavy load), we observed the data in the table below.
- The first column is a GT.M version or YottaDB release. Each YottaDB release is preceded by a GT.M version, the latest one whose source code is merged into the YottaDB release. r2.03-pre is the YottaDB code under development for r2.04 with V7.1-002 code and our enhancements and fixes merged prior to the critical section contention work.
- The second column shows an average elapsed time (i.e., less is better) for benchmark runs.
- The third column compares the elapsed times with GT.M V6.3-006, the last GT.M version released before the switch to pthread_mutexes (i.e., larger – more positive – is better; smaller – more negative – is worse).
- The fourth column compares the performance of each YottaDB release with the GT.M version it includes (larger – more positive – is better; smaller – more negative – is worse).
| Build | Elapsed time (milliseconds) |
vs. V6.3-006 | YottaDB vs. GT.M |
|---|---|---|---|
| V6.3-006 | 12,576 | – | – |
| r1.24 | 12,279 | 2.4% | 2.4% |
| V6.3-007 | 14,257 | -13.4% | – |
| r1.26 | 14,069 | -11.9% | 1.32% |
| V7.0-005 | 14,868 | -18.2% | – |
| r2.02 | 16,570 | -31.8% | -11.45% |
| V7.1-002 | 15,519 | -23.4% | – |
| r2.03-pre | 14,956 | -18.9% | 3.6% |
| r2.03-pre+ | 11,243 | -10.6% | 24.8% |
The last row, labeled r2.03-pre+ is the build after we included a host of performance improvements to code that executes inside critical sections (analogous to the time taken by each person to board the bus), and before our changes discussed below. It shows that even prior to the enhancements discussed below, the evolving YottaDB r2.04 code executed the 3n+1 benchmark 24.8% faster than GT.M V7.1-002.
(We were somewhat surprised by the r2.02 number, because such a slowdown has been the experience of neither us nor our users, and no such slowdown was apparent in our testing prior to the release. While it is perhaps an artifact of a specific benchmark, it is nevertheless the number we saw, and as we are objective developers, it is the number we are reporting here.)
The “Culprit”
It didn’t take long to discover that the change from the builtin mutex to pthread_mutex from GT.M V6.3-006 to V6.3-007 was the cause of the apparent slowdown. When we reverted to the builtin mutex (whose code we carefully examined for speed-up opportunities, which we implemented), we found that performance had been restored!
Then began the quest to determine what benefit pthread_mutexes offered, that motivated the change in V6.3-007. So we expanded the simulated workloads. One was a workload that simulated interest posting by a bank during day-end processing, and the other was code that did nothing other than to stress critical section acquisition. We ran all three benchmarks up to 16,384 processes, which is an extreme level of stress. While a large application can have 16,384 processes, it would be unusual to have that many processes contending for the same critical section at the same time. In the bus boarding analogy, it would be like a large bus terminal with many buses and many people, but with everyone wanting to board the same bus at the same time.
Behavior under extreme stress of the interest posting benchmark is shown below. With the 3n+1 benchmark, the YottaDB mutex always performed better.
- Times are in milliseconds, i.e., smaller numbers are better.
- r2.02 is the current YottaDB production release.
- r2.03 corresponds to r2.03-pre+ in the table above, i.e., just prior to changes to use the YottaDB mutexes.
- r2.03+mutex is the code with the change to use YottaDB mutexes.
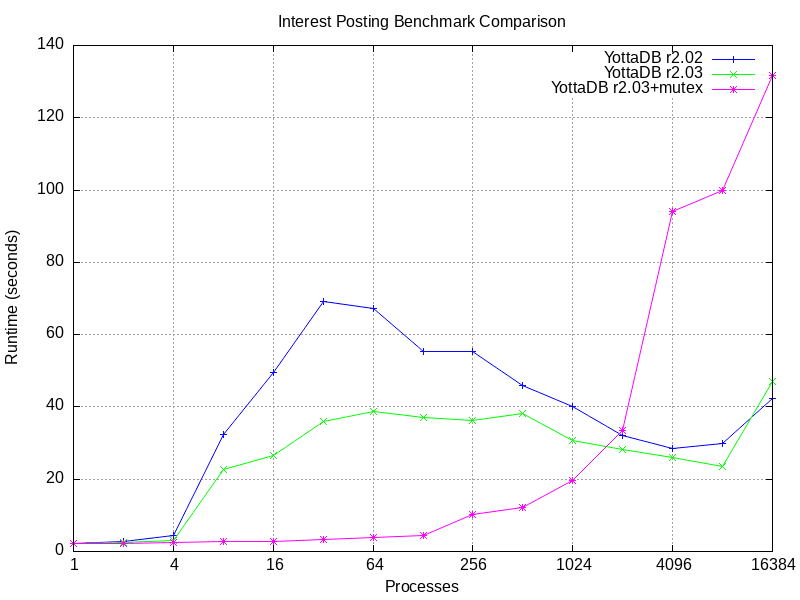
Two observations are evident from the graph.
- The changes to YottaDB r2.03 show a clear improvement over r2.02, analogous to speeding up the time it takes for each passenger to board the bus.
- YottaDB mutexes perform better than pthread_mutexes until around 2,000 processes, above which pthread_mutexes performed better. By analogy, when the number of people wanting to board the bus becomes large, externally organized queuing helps.
Adaptive Mutexes
That led us to the question as to whether it was possible to make mutexes adaptive, to use YottaDB mutexes at low to normal loads, to switch to pthread_mutexes under heavy loads, and to switch back under normal loads. By way of analogy, as the number of people wanting to board a bus increases to a point where they no longer organize themselves into a queue, one can bring in retractable belt barriers to organize a queue.
Important requirements of any adaptive method are:
- It must have minimal overhead: it should take minimal additional code to implement.
- Switching should be relatively inexpensive, especially the switch from YottaDB mutexes to pthread_mutexes. Since that switch happens under an increasing load, the switch should not further stress the system.
- It should have hysteresis, i.e., it should not bounce back-and-forth between the two techniques.
- It should not pretend to be universal: there will be workloads for which the adaptive method is not well suited.
Overhead is minimized by building on the existing database statistics, as reported by, for example, ZSHOW. While the statistics in the database fileheader record data from creation of a database file, switching is based on changes in the statistics.
A field in the database file header, which is mirrored in the shared memory segment for that region, records the current mutex type in use. Switching from YottaDB mutexes to pthread_mutexes is accomplished by setting the field to specify pthread_mutexes, and waking up all processes waiting for the mutex. There will be a momentary blip in CPU usage as the awoken processes execute pthread_mutexes. In an attempt to encourage fairness, the process initiating the switch awakens queued processes in the order in which they are queued; however, there is no guarantee that queue order will be preserved. Switching from pthread_mutexes to YottaDB mutexes is essentially the reverse, except that the processes are woken up by Linux, the manager of pthread_mutexes.
Switching from Linux mutexes to YottaDB mutexes occurs at a lower load than that at which switching from YottaDB mutexes to Linux mutexes occur. A heuristic that emulates a damped low-pass filter ensures that a load which randomly varies around the switching thresholds does not cause frequent switching back and forth.
The following graph shows the performance of the adaptive method. The interest posting benchmark is the same as the above graph; however, the results are from a different server. This benchmark showed similar results on all servers.
- Times are in milliseconds, i.e., smaller numbers are better.
- r2.02 is the current YottaDB production release.
- V7.1-002 is the GT.M version merged into the YottaDB code base.
- r2.03 (pthread mutex) corresponds to the r2.04 code base under development, with V7.1-002 merged, prior to the change to use the YottaDB mutexes.
- r2.03+ (ydb_mutex) corresponds to the previous item, with the change to use YottaDB mutexes.
- r2.03+ (adaptive mutex) corresponds to the code with the adaptive method.
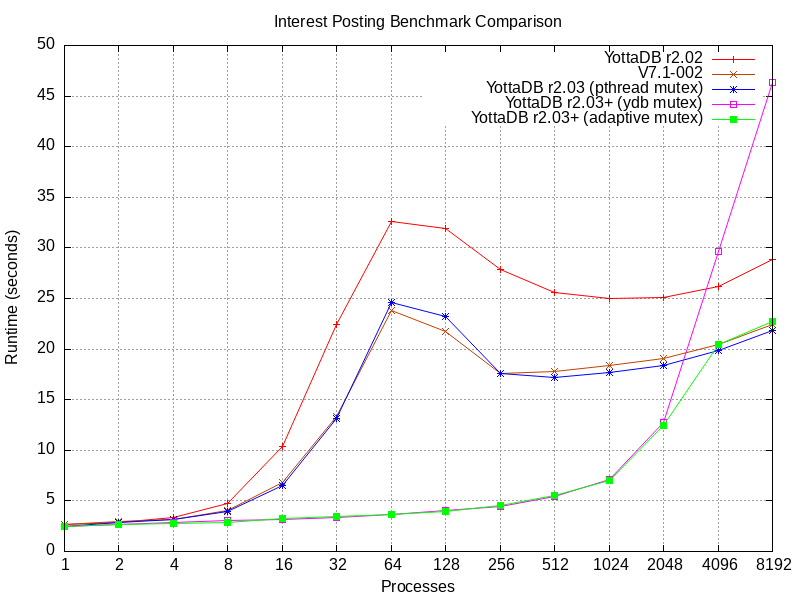
From the graph:
- The r2.04 code base with V7.1-002 merged tracks V7.1-002 – any differences are just the randomness inherent to benchmarking.
- Both the above show a significant improvement over 2.02.
- Benchmarks that use the YottaDB mutex and the adaptive mutex track each other, and are significantly faster than the above at workloads through 2,048 processes.
- Above 2,048 processes, the benchmark with the YottaDB mutex shows significantly worse performance compared to r2.03 (pthread mutex) and V7.1-002, whereas the adaptive mutex tracks r2.03 (pthread mutex) and V7.1-002.
In summary, the adaptive mutex adapts to the workload, and gives you the best option for the current load – you can have your cake and eat it too. In our analogy, it is as if when the number of people wanting to board the bus reaches a certain threshold, retractable belt barriers suddenly appear, and suddenly disappear when the number of people wanting to board drops.
Since there may be workloads for which the adaptive method does not work well, the YottaDB r2.04 code includes MUPIP SET commands to ensure that processes accessing a database region or file use only a specified mutex.
mupip set -mutex_type=adaptiveto specify Adaptive mutex, the default for newly created database files.mupip set -mutex_type=ydbto use the YottaDB mutex.mupip set -mutex_type=pthreadto use pthread mutex.
You also have to use either the -region or the -file option to identify the regions or database files for which you wish to specify the mutex type.
What Now?
As of today, the mutex code for r2.04 is stable and merged into the master branch, ready for the r2.04 release. We are currently working on other code for r2.04. Although not suitable for production use, the master branch is stable for development, testing, and benchmarking. If you care to try the r2.04 master branch to see how mutexes perform with your application workloads, here’s how to install the master branch.
export tmpdir=<tmp directory> installdir=<ydb installation directory>
mkdir -p $tmpdir
wget https://download.yottadb.com/ydbinstall.sh
chmod +x ydbinstall.sh
sudo ./ydbinstall.sh --from-source --branch master --installdir $installdir --nolinkenv --nolinkexec --nopkg-config
Once you are done testing, simply remove the installed YottaDB from $installdir: sudo rm -rf $installdir.
If you do test it, please share your results. Thank you very much.
Credits
- Photo of People Boarding a bus at Davenport and Oakwood, Toronto, in 1927 is in the public domain.
- Photo of Mango Bus stand Jamshedpur bus terminal by Shahbaz26 released under the Creative Commons Attribution-Share Alike 4.0 International license.
Published on October 09, 2025