Since it is time to bid 2022 goodbye, and welcome 2023, we at YottaDB would like to send you our heartfelt best wishes for a Happy New Year. We wish for you a happy 2023, ideally more uneventful and with less drama than recent years.
As you might expect, we have been developing software all year. YottaDB r1.36 is released, a new GUI awaits your beta testing pleasure, and Octo continues to gain additional functionality.
YottaDB r1.36 is a major release, not because it has a common theme, but because of the number of enhancements that it includes.
- On the x86_64 architecture, SUSE Enterprise Linux 15.x is a Supported platform
- There is new functionality for diagnostics, troubleshooting, and forensics. Of note, the %YDBJNLF utility program facilitates analyzing the voluminous information in journal files, including using SQL queries through Octo, e.g.,
select op,horologdate,horologtime,pid from YDBJNLFTYPE1 where gvref = '^CUST(5987154)' order by horologdate,horologtime;to find updates across multiple journal files to the customer record in global node ^CUST(5987154).
- There are enhancements to make programming easier.
r1.36 also inherits all enhancements and fixes from GT.M V6.3-012, V6.3-013, and V6.3-014 that were publicly released under a free/open source software license.
Full details are in the release notes at https://gitlab.com/YottaDB/DB/YDB/-/releases/r1.36
Please plan to upgrade your existing YottaDB installations to r1.36. We try hard to make every software release our best to date, and are confident that r1.36 will meet or exceed the quality you have come to expect of us.
We also have a brand new browser-based GUI console that is ready for you to beta test. After two prototypes that we abandoned but learned from, we have an approach that meets our needs. More importantly, we hope it meets your needs. An important feature is that all files, including JavaScript files, are versioned, and specific versions are served statically from the GUI installation, yielding better security and software stability over the long term.
To use the GUI, please follow the instructions at https://gitlab.com/YottaDB/UI/YDBGUI to install and start it. You will notice that while the GUI itself has no user documentation beyond the README, it has extensive hyperlinks to the YottaDB user documentation. Our goal is for the GUI itself to be intuitive enough to use without user documentation, while recognizing that for this goal to be feasible, user documentation for the depth and breadth of functionality in YottaDB must be at your fingertips. Please tell us how this works for you.
YottaDB Globals DarkMode
The GUI is currently in field test. Since writing software only opens the door to writing more software, there is more to come. At https://gitlab.com/YottaDB/UI/YDBGUI/-/issues you can see the Issues we are tracking. Please use the GUI and add your input.
- If there is already an existing Issue that fits your needs, you can give it a thumbs up vote (or a thumbs down if you disagree with it!).
- You can add a comment to expand on or clarify your views on an Issue.
- You can create a new Issue if you feel no existing Issue matches your input.
- Of course, you can also e-mail us.
YottaDB Routines
YottaDB Routines Dark Mode
We continue to add functionality to Octo. Our first target was reporting & analytics of YottaDB applications, running in a replicated instance. It is in production use today for that purpose. Our next target is as a read-write SQL database, and Octo today implements INSERT, UPDATE, and DELETE. We are currently working on selected related requirements like constraints and VIEWs. So it is possible to use Octo as a pure RDBMS with no awareness of globals, as well as with explicit mapping of tables to globals (the latter for reporting and hybrid applications that use both relational and direct access to data). Octo automatically ensures that any direct global variable updates from any of YottaDB’s supported languages automatically update cross references and statistics used by SQL access. We are also working on supporting Microsoft PowerBI as a client, which will allow the Microsoft business intelligence tools to access Octo.
We have created a Docker image that has the current master branches of YottaDB, Octo, and the GUI, as well as an instance of the VistA electronic health record system with dummy patients. You can use it by running:
docker run -d -p 2222:22 -p 1338:1338 -p 8089:8089 -p 9430:9430 --name=octo-vehu download.yottadb.com/yottadb/octo-vehu:latest-master
With the container running:
- Point a browser to http://localhost:8089 to use the GUI
- Point the SQuirreL SQL PostgreSQL JDBC driver to jdbc:postgresql://localhost:1338/VEHU to access Octo
Complete instructions for the container are at https://hub.docker.com/r/yottadb/octo-vehu
Note: To access the container from a different machine may require that you review firewall settings for the system on which the container is running. As we update the container regularly, you can always try our latest software.
So, in addition to saying Happy New Year, we can also say Happy New Software. Please stay in touch and let us know if you would like us to mail you a cap (details at https://yottadb.net/where-are-the-users/).
Where are the Users?Where are the users? Most assuredly, they are here on our planet, but where on Earth are they? For software released under proprietary licenses, one knows ones licensees at least in theory. But for code released under a free / open source software (FOSS) license that is free to anyone to use and redistribute, as all YottaDB software is, that is not as easy. To best serve users, whether or not they are customers, software developers should really understand the applications for which their software is used.
To that end, we are capping our user base! We have a supply of caps, pictured here, and modeled on our blog page by Sam and Bhaskar at the YottaDB table at All Things Open, and we can order more. Please e-mail us, and tell us about your interest in YottaDB. Ideally, we would like to know more about applications for which you are using, or intend to use, YottaDB. Even if your interest is just to get a cool cap, e-mail us with your mailing address, and we will send you one (or more, if you are writing on behalf of a group), wherever the postal services can find you. Incidentally, although the caps come from the manufacturer with a flat brim, you can curve it to suit.
Even if we don’t know who our users are, or what application YottaDB is being used or contemplated for (i.e., those who don’t want our cool caps!), we will be using Scarf to help us deduce the country and organization from the IP address metadata, conforming to both European and California privacy regulations. Note that we are not tracking you: we are only gathering statistical information. The folks at Scarf are easy to work with, by the way.
If you do not wish to add a data point to the statistical information, you can use a VPN, or get our software directly from our Gitlab project pages. Scarf also has instructions on configuring your browser so that Scarf does not look at the IP address metadata. But we sincerely hope you will help us further our ambitions to be fashion purveyors, not just software developers!
Comparing YottaDB Web Framework PerformanceWe welcome Ram Sailopal back for his second guest blog post. Read his first post on the YottaDB Dashboard here.
Background and Motivation
With its “many languages, one database” philosophy, the daemonless, language-agnostic database YottaDB, provides in-process APIs from multiple languages — C, C++, Go, Lua, M, Node.js, Perl, Python, and Rust today. Some language APIs (“wrappers”) are developed by YottaDB, and some by others in its ecosystem. While every language has its philes and phobes, there are entirely rational reasons to select a language, including:
- Developers & Tool Chains – If you have developers skilled in a language or an available proven tool chain in a language, it maybe simpler to use that language than to train your developers in another language, or to implement a new tool chain.
- Performance & Throughput – Users need to get data quickly, and as the number of users ramps up, any performance degradation should be gradual.
- Robustness – Since it is anathema to deliver incorrect results, all language stacks return correct results. However some stacks may experience drop-outs, lost connections, and timeouts, which detract from the user experience.
The basic model of a web stack consists of a web server and a back-end.
It is interesting to compare the performance of different web stacks and frameworks under simulated stress. To compare apples-to-apples, the database, the JSON string response to a REST query, and front-end load generator were the same.
Of course, this end-to-end test only involves a single operation. Any real application consists of many operations at different layers in the framework, only a fraction of which are database accesses.
Test Setup
The database consisted of the following hierarchical key-value tuples:
^PATIENTS(1,"address")="234,Timbucktwo Road, Fantasy City"
^PATIENTS(1,"age")=52
^PATIENTS(1,"name")="Bob Taylor"
^PATIENTS(1,"sex")="Male"
which was delivered by the back-end in response to a REST query as the following JSON string:
[{ "id": "1", "name": "Bob Taylor", "age: "52", "sex": "Male", "address: "234,Timbucktwo Road, Fantasy City" }]
Each test stack used two containers both hosted on Gitpod. The front-end load was generated by Locust, running in a container with the web server and the back-end running in another.
Note: In some cases, where the same software is capable of being both the web server and the back-end, separate copies were run, in order to keep the comparison apples-to-apples. In specific situations, such as an in-house application, it may of course be appropriate to run a single copy of the software as both the web server and the back-end.
Apache is used as the web server, including for mgweb-server, which incorporates Apache. The table below lists the back-end that was used for each language. Each test container has a name for identification, and the names link to the detailed results for that stack. Native C and the Perl wrapper were not tested.
| Language | Test Container | Web Server | Back-end |
|---|---|---|---|
| C++ | yottac | Apache | Crow+Informatik Aalen CPP-Access-for-YottaDB |
| Go | yottago | Apache | Gin+YottaDB Go Wrapper |
| Lua | yottalua | Apache | Pegasus+YottaDB Lua Wrapper |
| M | yottamgweb | mgweb-server | |
| M | yottaweb | Apache | M-Web-Server |
| Node.js | nodem | Apache | Express+Nodem |
| Node.js | mgdbx | Apache | mg-dbx |
| Python | yottapython | Apache | Flask + YottaDB Python Wrapper |
| Python | yottamg_python | Apache | mg_python |
| Rust | yottarust | Apache | Rocket+YottaDB Rust Wrapper |
In each case, the load simulated 1,000 concurrent users, and each test involved approximately 100,000 requests.
As expected, running a stress test against a multi-layer application running in one container generated errors, characterized as follows:
- A web server starts servicing a request, runs out of resources, and is unable to complete the request.
- A web server lacking the resources to accept a resource for servicing.
- A crash while servicing a request.
The detailed results for each stack include the errors for that stack.
Results
Click here — Overall Results — to view the overall results, summarized below.
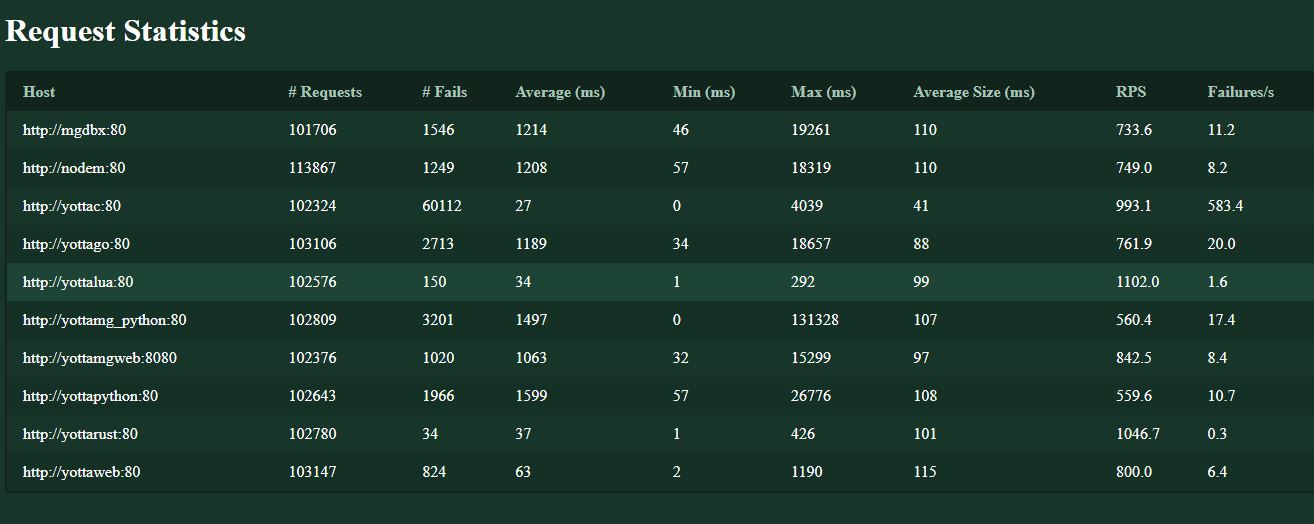
The surprising result is that the winners are the Lua and Rust frameworks, both delivering better performance as well as fewer errors than the native M frameworks. The C++ stack is interesting, because while it delivers good performance, its failures make it an outlier.
All tests are available at YottaWeb-Test. Please do try the tests in your environment, and if you have enhancements to add or results to submit, please submit a Pull Request on GitHub.
About Raman Sailopal
Images Used:
[1] World wide web. Photo by Svilen.milev.
[2] BCL – spiderweb. Photo by vastateparksstaff.
Screenshot courtesy Raman Sailopal.
Summary
Every day, we find fault with our software, so that you don’t!
Robustness in software is a mark of quality that’s often easy to lose in development.
Thanks to Zachary Minneker of Security Innovation, Inc., we are implementing fuzz testing to make our software even more robust. Fuzz testing provides us with one more way to generate test cases to test that the software does not do what it is not supposed to do. As expected from a new form of testing, we have discovered bugs that we did not know existed, and which no user has reported to us.
Fuzzing
 The word “fuzz” is hundreds of years old. More recently, it has been used in music for deliberate distortion, typically guitar sounds. Fuzzing as a test method is relatively recent. At its most basic, fuzzing involves running a piece of software over and over with generated inputs, usually invalid, while attempting to exercise as much code as possible. As fuzzing has developed and the state of the art has changed, fuzzing techniques have grown more elaborate and now involve complex tooling and techniques.
Rejection of invalid input by the software, by discarding it, rejecting it, or reporting it, are all appropriate behaviors, depending on the software specification. Behavior such as process termination (unless that is the specified behavior for invalid input), inconsistent internal state (such as overwriting memory), or worse yet, undesirable behavior are bugs to be fixed.
Fuzzing YottaDB
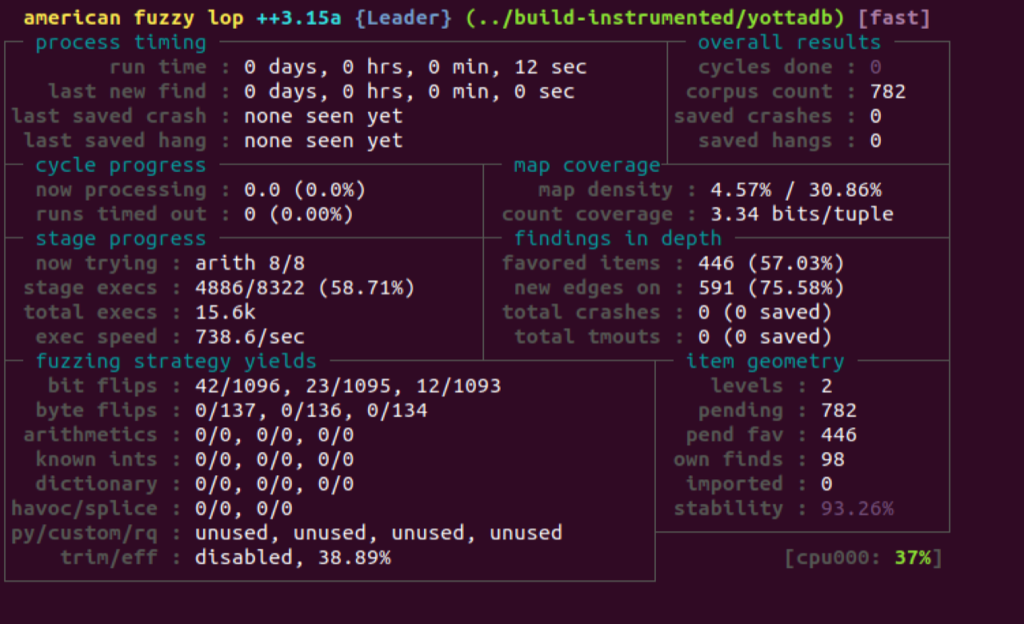
Zachary Minneker from Security Innovation tested YottaDB by feeding the compiler manipulated M code. While it is certainly possible to input randomly generated bytes, most of the input would be rejected by the parser, and the fuzzing would not be efficient, even though it would theoretically eventually expose every issue with the software (see the Infinite Monkey Theorem). To fuzz efficiently, Zachary started with a corpus of M source code from the YottaDB automated test suite, and made some minor changes to YottaDB to make unexpected behavior more easily detected. Then a 24-core machine running the prepared fuzzing harness and corpus fuzzed YottaDB for a number of days, over the course of several months.
He used AFL++ to generate fuzzed input to YottaDB. AFL++ works by using special tracing instrumentation which marks conditional paths through YottaDB. During execution, the exact path taken through the code is found by noting which conditional paths are taken using a mutated input. If an input causes new paths to be taken it is added to the corpus for further fuzzing, which then increases the amount of code paths taken.
Since YottaDB has signal handlers for normal operation, as well as to catch signals in order to shut down cleanly, he commented out the signals as they would interfere with the testing. In some cases, he used AddressSanitizer, a tool which makes otherwise difficult to detect memory bugs crash the application.
YottaDB can respond to input M code in different ways:
- Flag a syntax error. Since YottaDB is expected to generate syntax errors for syntactically incorrect code, this input is not very interesting from a testing point of view.
- Run the code. This is also not very interesting from a fuzz testing point of view: even if the code adds 2 and 2 to get 5, that should be caught by normal functional testing.
- A YottaDB built with the address sanitizer reports an address error. This is YottaDB failure to be captured.
- Crash. This is potentially a YottaDB failure, because except in cases such as a process sending itself a signal with $ZSIGPROC(), processes should not terminate abnormally.
- Hang. A hang by itself does not tell the fuzz tester much because the fuzzed code might include a syntactically correct infinite loop. But a hang might indicate a memory bug.
Some bugs may have multiple ways in which they can be triggered. Zachary eliminated duplicates, created minimal inputs for each failure, and performed root cause analysis. After months of work, he identified failures that are captured as CVEs and as a YottaDB Issue against which our development team is creating fixes.
Practical Implications
Failures identified by Zachary’s fuzz testing are potential security issues because:
- A crash is in principle a denial of service.
- An error that overflows a buffer, or overwrites memory is in principle a vector for attack if an attacker is able to load and execute an exploit into memory that is overwritten.
- An error that causes bad object code to be generated is in principle a vector for attack if an attacker can load code to be executed in to the object code.
As a practical matter:
- The failures are caused by code which is syntactically correct, but functionally useless in the context of an application. Any YottaDB deployment is controlled code that has gone through developers and is tested: your YottaDB application certainly would not execute code from the web without validating it.
- Exploiting any of the vulnerabilities requires the ability to modify the M code which your system is executing, which requires login access to the system.
- Except for process crashes, where the crash itself is the exploit, vulnerabilities are chinks in the armor, not exploits. Turning these vulnerabilities into an exploit (which requires M code to be executed) would require an order of magnitude, or more, of effort.
Controlling access to your system, and validating M code executed, are two key layers of defenses against all vulnerabilities.
What Next?
Since security is a journey, not a destination:
- We are accelerating the YottaDB r1.34 release with fixes identified by Zachary’s fuzzing, and expect to release it in mid Q1 2022, rather than later in the year. This means that some other issues targeted for r1.34 will be deferred to r1.36.
- Unlike tests in our automated test suites, where you can run a test and have it pass or fail, fuzz testing is a type of random walk that you run continuously till you find something interesting. We will dedicate hardware to continuous fuzzing. As it finds issues, we will fix them in releases of YottaDB.
- We will start fuzz testing Octo.
In Conclusion
Although perfection does not exist in this universe, you can be assured of our continued commitment to your YottaDB experience being as rock solid, lightning fast, and secure as we can make it.
In closing, we would like to reiterate our thanks to Zachary Minneker and Security Innovation for introducing us to fuzz testing.
Images Used:
[1] Fuzz – Rock en Seine. Photo by Alexandre Pennetier.
[2] Keeley Fuzz Bender pedal. Photo by Skimel.
Screenshots courtesy Zachary Minneker.
It is hard to believe that another year has gone by. As always, we wish you and yours a Merry Christmas, Happy Hannukah, Joyous Kwanzaa, Bright Karthigai and a Happy New Year – plus any festive occasion for the season that we may have missed.

 A year ago, we hoped that by now we would have put the pandemic behind us, and that life would go back to being “normal”. In 2021, we came to the conclusion that we need to adapt to a new normal. Some of us moved away and became permanent telecommuters. Some of us are mostly working from the office, being more productive there. Some of us have a hybrid model, working partly at home and partly at the office. One of us (Sam) is doing something unique: he has been staying at motels and rentals near national parks, using the opportunity to explore the great outdoors. He recently completed a rim-to-rim hike of the Grand Canyon, which the rest of us can only experience vicariously! The picture above is from that hike.
We are well on the way to an Octo release with read-write capability. INSERT, UPDATE, and DELETE commands are completed, and we have SQL and operational functionality remaining that we think should be part of that milestone. While we hoped to release this in 2021, we would prefer not to fall short of your expectations with respect to the robustness of the software, and our current target is Q1 2022.

 You can always download and use what we have at any time. As discussed in our blog post YottaDB Continuous Integration / Continuous Delivery, thanks to our CI pipeline, the master branches of our source code repositories have the latest code that passes all tests, and is production grade. The exception is the core YottaDB software, releases of which involve multiple cycles of an extensive test suite across a network of machines, testing which cannot yet be made into a CI pipeline. The ydbinstall.sh script has options to download and install YottaDB as well as plugins. Each language wrapper is installed the way that developers of that language expect packages to be installed (e.g., the Go wrapper is installed the way that Go developers expect Go packages to be installed).

For 2022, we wish you good software, good documentation, good health, happiness, and much more. We wish for 2022 to be your best year yet. Please stay in touch!
YottaDB Continuous Integration / Continuous DeliveryAt YottaDB, we always want to get you our latest software (moving from the “release early, release often” mantra of free/open source software (FOSS) to “release continuously”) without compromising our foundation of “Rock Solid. Lightning Fast. Secure.”
With our Continuous Integration / Continuous Delivery (commonly abbreviated together as CI/CD) pipeline, the latest YottaDB software is ready for you to run at any time – you do not have to wait for a formal release. It is as simple as:
- git clone the repository
- Follow the steps in the README to build and install the software
All YottaDB software, except the YottaDB database, has a GitLab CI/CD pipeline of functional tests for code changes to be merged. The YottaDB database goes beyond this (see below).
Confidence in software quality is a prerequisite for CI/CD, and software quality is what builds that confidence.
Software Quality
Although there are many ways to measure software quality, all of them boil down to confidence in the software. This means having confidence not just that the software does what it is supposed to do, but also that the software does not do what it is not supposed to do.
While it is hard enough to test that software does what it is supposed to do, how does one test that software is not doing what it is not supposed to do? While it is not practical to test that software does nothing that it is not supposed to do, a good proxy is to test that it continues to do everything that it is supposed to do, even for small changes.
Testing for everything that software is supposed to do requires repeatability, which in turn requires automated testing.
Our YottaDB development process includes automated testing. Code changes have corresponding automated tests that distinguish between the “before” and “after” behaviors of the change. Both the code and automated tests go through peer reviews, and changes in response to review comments are approved by the reviewer. In those rare cases where automated tests are impractical (handlers for unusual error conditions, minor performance improvements, etc.), the code changes go through more critical peer reviews.
It does not suffice for us to have confidence in our software. You, our users, must have confidence in our software. To that end, code changes we make are approved by reviewers, and visible under our projects at GitLab. Comments made in the review process are public, as well as responses, and the actual merge.
While the process is not perfect – software bugs will not be eliminated in our lifetimes, if ever – it does engender confidence in the software, which is the best we can do, given that perfection does not exist in our daily lives.
CI/CD Pipeline
 With automated tests, we create GitLab CI pipelines. A pipeline consists of a set of tests that collectively either pass or fail. When we create GitLab Merge Request pipelines for our packages with rules that require the pipeline for a package to pass before a Merge Request is merged into the master branch of that package, we gain confidence not only that the Merge Request does what it is supposed to do, but also that it does not do what it is not supposed to do.
Installing YottaDB Software
Prerequisites
Binary distributions are provided only for the YottaDB database.
Our other supported software consists of :
- wrappers that provide APIs to YottaDB from languages such as Go, Perl, Python, and Rust (the YottaDB database includes access from both C and M), and
- plugins such as Octo for SQL access are installed by cloning the appropriate repository, and following instructions to build and install the software.
This means you must have the build tool chain for each software installed on the system. The prerequisites are listed in the README for each software package.
Should a production system not have tool chains installed, e.g., for security reasons, you can build and install the software in another machine, in a virtual machine, or in a container in the same directory as the production system, and then clone the directory with the installed software to the production machine ensuring that ownership and permissions are maintained.
While the installation instructions for wrappers depend on the requirements of the language for which a wrapper provides an API, the YottaDB database and plugins can be installed using the ydbinstall.sh script.
The ydbinstall.sh Script
The ydbinstall.sh script (which when packaged with a YottaDB binary distribution is named ydbinstall), downloads and installs YottaDB and plugins:
- Copy or download the script from https://gitlab.com/YottaDB/DB/YDB/-/blob/master/sr_unix/ydbinstall.sh into a temporary directory.
- Make it executable.
- Run it. For example, to download and install the latest YottaDB binary distribution, and to download, build, and install the Octo plugin, you can execute sudo ./ydbinstall.sh –utf8 default –octo – as the script manages dependencies, specifying –octo also downloads and installs the POSIX plugin, which Octo needs.
- The –from-source option allows you to git clone the YottaDB database repository, build it, and install it, like any other YottaDB software. This allows you to get the latest YottaDB software without waiting for a binary distribution.
- ./ydbinstall.sh –help gives you a full list of options. If YottaDB is already installed, you can use it to install, add, or update plugins.
YottaDB Binary Distributions
 A large part of the code in the YottaDB database provides error recovery, replication, large databases, etc., features that are not practicable to test in a CI pipeline. This is analogous to the fact that you cannot test the seat belt of a car by driving it, no matter how far you drive it. Yet, if you are going to drive that car every day for years, you must have confidence that the seat belt will be there to protect you in the unlikely event of a crash.
At YottaDB we have a network of a couple dozen machines that include all Supported platforms, ranging from Raspberry Pi Zeroes to x86_64 servers. We run the YottaDB test system across these machines most weekends, and frequently overnight as well. The normal run checks out the current master source code, builds it, and runs it on these machines against the current master test system. The source code is built and tested two ways, “DBG” builds with asserts that detect error and out-of-design conditions for us to debug, and “PRO” builds that are built the way binary distributions are delivered, and which invoke the recovery code for these error and out-of-design conditions. The tests involve extensive simulated crashes and recovery. They also randomly vary a number of parameters to test the various permutations and combinations of operating conditions.
Our released binary distributions are PRO builds that have passed the test system on our machines, and therefore are the ones we recommend for production use.
Since code changes must pass the test system, the ydbinstall.sh script also offers options to clone, build, and install the current master code branch at GitLab without awaiting a formal binary release. These builds are suitable for use in non-production development and testing environments.
The continuous testing of our software means that once a feature or a fix has made it into the master branch of the source code, we can provide a supported customer with a production grade distribution with that feature or fix in about a week.
Our CI/CD process allows you to have your cake and eat it too.
Pipe Theme Images Used:
[1] Console of the Wannamaker organ at Philadelphia. Photo by col_adamson downloaded from Wikimedia Commons.
[2] Astronaut and Expedition 64 Flight Engineer Shannon Walker of NASA connects new Gigabit Ethernet cables linking the Unity, Tranquility, and U.S. Destiny laboratory modules aboard the International Space Station. Photo by NASA Video and Image Library downloaded from Wikimedia Commons.
[3] A bagpiper and member of the Queen’s Bands (Queen’s University, Kingston, Ontario) wearing a full plaid in traditional highland dress. Photo by Greenmind downloaded from Wikimedia Commons.
[4] Centre Georges Pompidou, Paris, France. Photo by RG72 downloaded from Wikimedia Commons.
YottaDB Dashboard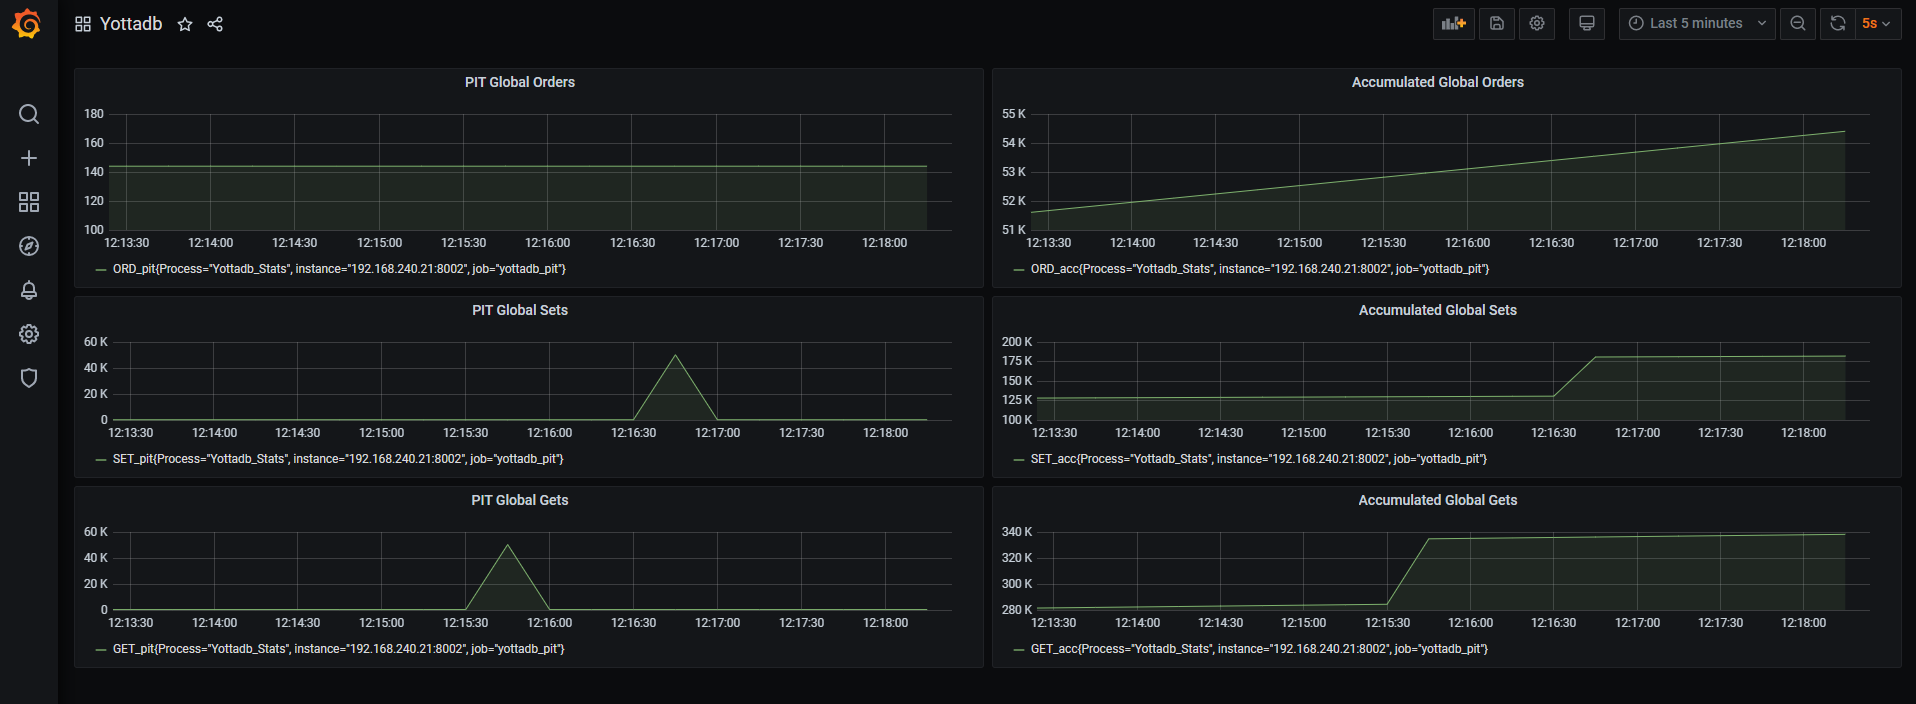
Introduction
Users of YottaDB know the benefits of using it. Its technology was established decades ago and it is used in critical medical and financial systems worldwide. Performance overall is “lightning fast” but performance is not simply a binary consideration. A system may perform well at one point in time with a certain workload and not as well at another. As an IT professional, be it a SysAdmin in a traditional IT role or a DevOps engineer in a more modern one, it is important to continuously capture and monitor performance. Monitoring performance allows for the establishing of baselines, including daily, weekly, and monthly cycles, to create trendlines, not only for capacity planning, but also for detecting, diagnosing, and remedying issues. Since human beings interpret visuals well, tools like Prometheus and Grafana make it easier to visualize captured performance data.
Performance Considerations
The causes of performance degradation may be at a system level in terms of CPU or memory that may need scaling but equally it may be at a software/database level in terms of changes in code that may have been released. With modern day DevOps practices adopted along with Continuous Deployment and sometimes multiple releases a day, the monitoring of the effects of software releases is critical, and indeed imperative, to any DevOps process.
Monitoring performance is useful not only for capacity planning and dealing with problems. It can also add business value by identifying times when there is greater demand on a system. Identifying times of greater demand can allow for a better coordination of “targeted” marketing campaigns. For example, if monitoring were to detect a spike in activity from college towns on the first Tuesday each month, that might lead to an insight that perhaps, that is a day when scholarships are disbursed, and students are buying more beers.
YottaDB Performance metrics
At present, there are monitoring capabilities built into YottaDB. The options are as follows:
Additionally there is Gvstat:
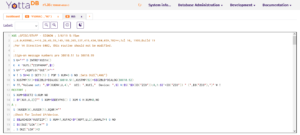
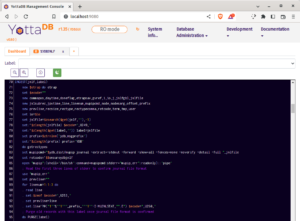
All three options provide valuable information such as global sets, gets and kills but the information is somewhat “one dimensional” when viewed and more suited to consumption by software than by humans, e.g:
BTD:124,CAT:221,CFE:0,CFS:0,CFT:0,CFavg:0,CFsigma:0,CFvar:,CQS:0,CQT:0,CQavg:0,CQsigma:0,CQvar:,CTN:199,CYS:0,CYT:0,CYavg:0,CYsigma:0,CYvar:,DEX:0,DFL:2,DFS:1,DRD:17,DTA:60,DWT:124,GET:345,JBB:23192,JEX:0,JFB:286720,JFL:2,JFS:7,JFW:70,JRE:1,JRI:0,JRL:198,JRO:4,JRP:5,KIL:1,LKF:0,LKS:2,LKfrate:0,NBR:1627,NBW:159,NR0:0,NR1:0,NR2:0,NR3:0,NTR:555,NTW:199,ORD:144,QRY:0,SET:197,TBR:0,TBW:0,TC0:0,TC1:0,TC2:0,TC3:0,TC4:0,TR0:0,TR1:0,TR2:0,TR3:0,TR4:0,TRB:0,TTR:0,TTW:0,ZPR:1,ZTR:0
Further details about these metrics can be found here in the YottaDB documentation.
Enhancing Usability
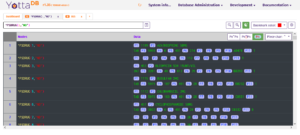
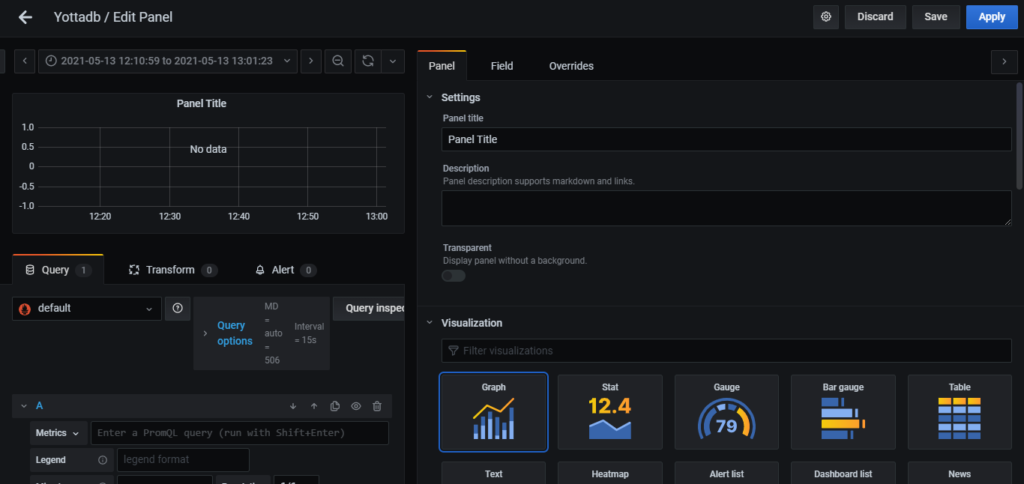
In order to translate this information into a format that better allows trend analysis, we need to be able to graph the data against time. This is where YottaDB-dashboard can help.
YottaDB-dashboard utilizes the following technology stack:
- Grafana – An open source interactive metrics visualization tool.
- Prometheus – An open source metrics querying tool that integrates with Grafana.
- YDBGvstat (referenced earlier)
Utilizing YDBGvstat, YottaDB-dashboard runs an “exporter” presenting the YottaDB metrics periodically via a web server process. Taking an example YottaDB SET metric, the web server process will present data in the example form:
# HELP SET_pit Number of SET operations (TP and non-TP)
# TYPE SET_pit gauge
SET_pit{Process="Yottadb_Stats"} 197.0
This data is then “consumed” by Prometheus, interpreted, and then presented to Grafana via a Prometheus plugin.
Setting Up
- Install Grafana – https://grafana.com/docs/grafana/latest/installation/ – or from your Linux distribution’s package manager, if available.
- Install Prometheus – https://prometheus.io/docs/prometheus/latest/installation/ – or, like Grafana, from your Linux distribution’s package manager.
- Run the YottaDB metrics “exporter” by following the instructions at https://github.com/RamSailopal/YottaDB-dashboard/blob/main/README.md
- Add the extract found at https://raw.githubusercontent.com/RamSailopal/YottaDB-dashboard/main/prometheus.yml to the prometheus.yml config file in /etc/prometheus. Change the IP address and port to the address/port of the server where the “exporter” is running accordingly.
- Start Prometheus.
- Start Grafana and log into the web interface (default port is 3000, default username and password is admin/admin).
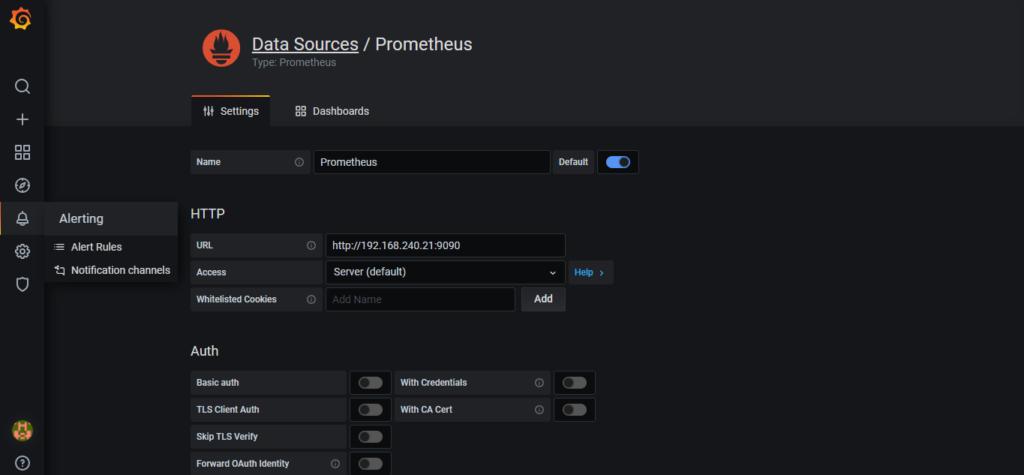
- Click on the cog icon on the left hand side representing configuration, then Data Sources and Add Data Source. Select the Prometheus data source. Name it and then enter the URL. Click Save and Test to ensure it is working.
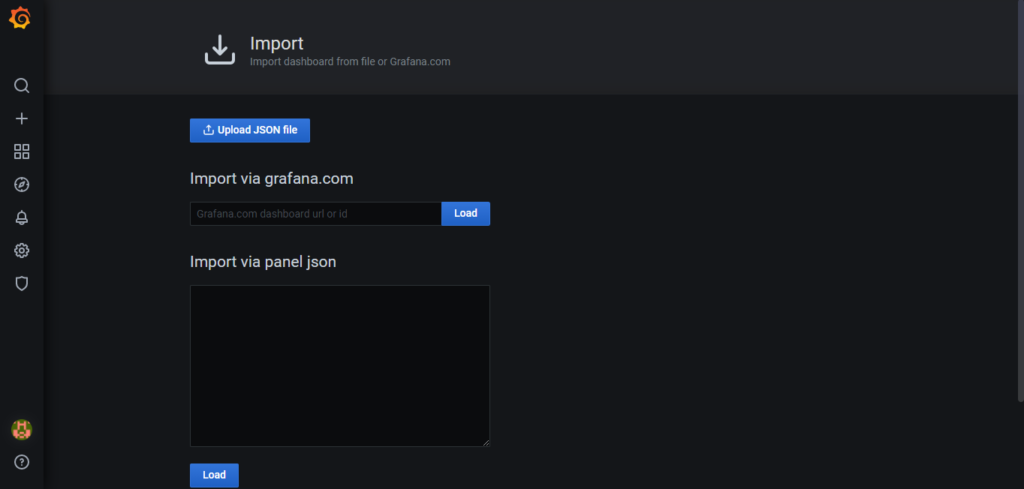
- Click on the four square boxes icon on the left hand side representing Dashboards. Click Manage and then Import. Paste the JSON found here – https://raw.githubusercontent.com/RamSailopal/yotta-dashboard/main/examples/Yottadb-grafana.json to the json panel. Click Load.
- A dashboard will then be created showing Orders, Sets and Gets metrics. To add further metrics, click on the add panel icon, then click the Metrics “drop down” option in the Query section, ensuring that Prometheus is selected as the data source. All the metrics exported from YottaDB should now appear for selection to chart in a panel.
The Grafana/Prometheus technology stack, be it on physical servers or containers, can further be harnessed to view memory/CPU consumption along-side software metrics as discussed earlier. Additionally, it can be used to monitor database size. System metrics relevant to YottaDB are available as YottaDB-dashboard metrics. The technology stack can also be further added to, by incorporating Grafana Promtail and Loki components to view and interrogate YottaDB system logs. Anybody looking for further information can visit the YottaDB-dashboard Wiki.
Conclusion
YottaDB has open source at its core. This embracing of open source, allows it to be integrated with other open source tools to further extend its capabilities and benefit a wider range of users operating in different areas of IT operations.
The YottaDB-dashboard also has tools and information to help you provision a virtual machine with the YottaDB + Prometheus + Grafana stack using Ansible and Vagrant.
About Raman Sailopal
 I am a professional with over 20 years of experience working in the IT industry. I reside in Birmingham, UK (hence the Birmingham themed pictures). My very first corporate interaction with IT involved using M technology within the UK medical sector and although my journey with IT has seen me follow paths involving Linux, Cloud architecture and open source, I have always held a fond regard for M based technologies and their potential with critical IT systems. Working with YottaDB allows me to combine these passions and contribute to the growth of both M and open source.
Images Used:
[1] Young man taking the Peaky Blinders soundtrack album out of his vinyl collection. Photo by Jonas Leupe.
[2] The Canal House, Birmingham. Photo by Danilo D’Agostino.
Screenshots courtesy Raman Sailopal.
We thank Yazeed Smadi for his guest post on the YottaDB blog and hope there are many more to follow. If you would like to post on the YottaDB blog, please contact us at info@yottadb.com.
 Background
At one of the biggest VistA EMR sites, Hakeem (VistA adapted to the requirements of healthcare in Jordan) was running well, with one exception: when running a MUPIP REORG operation for the database defragmention, the system had an IO bottleneck. After tracking the issue and linking it to the database growth and usage trends, the root cause was found to be related to low Hard Disk Drive (HDD) performance which could not perform a MUPIP REORG operation without impacting user experience.
To resolve this issue, we decided to upgrade the server’s HDD to Solid State Disks (SSDs). After installing the new disks the performance became unpredictable and the application performance degraded the user experience .
Symptoms
Following were the symptoms we observed, along with degraded application performance :
- The new SSDs were operating as expected, with no IO delays or bottlenecks.
- There were no processes in the “D” state, waiting for IO.
- Apart from degraded performance, the application was behaving normally and delivering correct results.
- The only anomaly was that the CPU run queue increased in a semi-linear trend, sometimes reaching 120, but the server had 86 CPUs running at 100% capacity.
Solution
It took us about fifteen hours of troubleshooting, to find a solution: Set a tuned profile to throughput-performance profile:
tuned-adm profile throughput-performance
systemctl restart tuned
During the troubleshooting phase; it was clear that the CPU queue was going high while it shouldn’t have! This was causing the poor system performance. The only fact that brought to mind the idea of enhancing CPU performance by setting the tuned profile to throughput-performance , thus forcing the CPUs to work at maximum performance, was https://github.com/redhat-performance/tuned/blob/master/profiles/throughput-performance/tuned.conf.
After enabling this profile, the system performance improved, and the CPU queue became empty in a few seconds!
The Root Cause
After successfully resolving the issue, based on IT operation management strategy in EHS, we initiated the problem management process to find the root cause and to prevent it from happening in the future.
The server model used for this site is HP ProLiant DL380 Gen9, which has a BIOS setting for CPC (Collaborative Power Control) set to OS Control mode (located under Power Management -> Power Profile -> Advanced Power Options -> Collaborative Power Control). This feature enables the OS kernel to use Processor Clocking Control (PCC). When CPC is set to OS Control mode; the OS will control the use of intel_pstate, and since the initial OS tuned profile was set to ondemand; the OS did not utilize the full CPU performance and under production workload it lead to low performance.
The OS installed on the new disks is RedHat Enterprise Linux 7.9 (RHEL); which installs the CPU driver pcc-cpufreq driver for this server model. Using this driver will set the tuned profile to ondemand by default.
Therefore; we recommend overcoming this issue by using one of the following solutions:
- Set the tuned profile to throughput-performance: this profile will set the maximum performance for the server’s CPUs, because it includes the following CPU settings
[cpu] governor=performance energy_perf_bias=performance min_perf_pct=100 - Disable CPC in the server’s BIOS by changing it to Disabled
Lesson
When doing system performance enhancement by upgrading hardware, it is mandatory to review software performance related settings!
 About Yazeed Smadi
Yazeed Smadi leads the Linux System Administration team at Electronic Health Solutions, Amman Jordan. A graduate of German Jordanian University and Technische Hochschule Deggendorf, he worked on blockchain software at T-Mobile in Germany before returning to Jordan. Yazeed is passionate about DevOps automation and has scripted automated YottaDB switchovers to take place in under one minute using Jenkins. Since the world’s best falafel is found in Jordan, Yazeed and Bhaskar together try to find the best falafel in Amman when Bhaskar visits EHS!
Building Rich Web Applications with YottaDBWe thank Rob Tweed for the first guest post on the YottaDB blog and hope there are many more to follow. If you would like to post on the YottaDB blog, please contact us at info@yottadb.com.
Background
YottaDB is the perfect database to support Web Applications:
- It is hierarchical key-value, “global variable”, storage model is incredibly flexible, allowing any database architecture to be modeled on top, including:
- relational (with SQL support);
- JSON/document;
- lists, stacks and/or queues;
- graph;
- tables and/or columnar stores; and
- Document Object Model (e.g., XML with XPath support).
- It is Free / Open Source database technology.
- It is incredibly fast, with key/value storage operating at or near in-memory speeds.
- It is highly scalable and robust.
- It is tried and tested, with a long and respected pedigree spanning decades, supporting, amongst other things, the highly demanding needs of large-scale, commercial, real-time banking systems.
For YottaDB to be a Web Application database, it must be integrated with a Web Server. The Web Server provides the outward-facing HTTP/HTTPS interface by which web browsers and REST clients communicate with the web application server.
Over the years, there have been numerous solutions for web-enablement of YottaDB, including:
- CGI or FastCGI solutions;
- the MGWSI interface from M/Gateway Development Ltd; and
- a web server written in the M language.
M/Gateway Developments Ltd have recently introduced new solutions:
- the low-level mg_web integration interface;
- mgweb-server, a high-level platform, built on top of mg_web that provides a pre-packaged solution for quickly and easily creating a YottaDB-based API Server.
This post looks in more detail at mg_web and mgweb-server to examine their benefits over the existing solutions for YottaDB.
 Why mg_web?
Since YottaDB can already be configured as an effective and potent web application platform using existing solutions, why consider the new M/Gateway solutions? Chris Munt, mg_web’s developer, had a number of design goals:
- Leveraging industry-standard Web Servers: Web Servers are no longer the simple HTTP-enabling technology they used to be. They are now very complex pieces of technology. The overwhelming majority of web traffic on both the Internet and within organizations is handled by just three Web Servers:
All three are well understood by their respective users, and each is more than capable of meeting the needs of modern web applications and API servers where performance, reliability, scalability and security are key. Chris believes that it makes sense to use these industrial-strength web servers for your industrial-strength, mission-critical applications. mg_web works with all three web servers.
- Exploiting the latest Web Server architectures: Most of the techniques used for web-enablement of YottaDB were first developed when the web was in its infancy. Since then, all three major Web Servers have moved to ultra-high performance, event-driven, asynchronous architectures which the existing solutions for YottaDB fail to exploit. By contrast, Chris took the opportunity to design mg_web from the ground up to work with and exploit these latest design features of Web Servers.
- Meeting the emerging needs of the modern web: Two features of Web Servers are growing in importance:
- Security: HTTPS over TLS (*aka* SSL) is likely to become mandatory soon, and Web Servers need to be able to support a growing number of security-related features and specialised HTTP request and response headers. By working with all three major Web Servers and allowing them to handle the complexities of these ever-changing and evolving security needs, Chris designed mg_web to future-proof your web-enabled YottaDB service.
- Performance: The simple text-based protocol used for REST and web traffic is increasingly being replaced by the newer HTTP/2 protocol. HTTP/2 brings some key benefits, the main one being the improvement of page loading times by:
- The use of a binary transfer format instead of the previous text format
- Multiplexing of requests for resources, meaning, for example, that a browser can fetch multiple resources (i.e. HTML, CSS, JavaScript files) simultaneously via a single TCP connection rather than, as previously, having to open multiple TCP connections
- Compression of header frames to reduce the size of transmitted payloads
Implementing the much more complex and demanding HTTP/2 protocol is something best left to the major Web Server suppliers, for whom it’s core business. Chris ensured that mg_web fully supports HTTP/2, meaning your YottaDB web applications and API Services can take advantage of the benefits of HTTP/2 immediately.
- Supporting the move from server-side to client side applications: Early web-enablement of YottaDB applications focused around server-side logic that dynamically generated web pages served up to users’ browsers. Since then, the industry has almost completely evolved to client-side applications where JavaScript-based logic runs in the browser and the role of the back-end is now primarily to serve up data in the form of JSON-formatted responses: the so-called REST API Server role. The existing YottaDB solutions don’t actually tend to be optimised for such a role. Chris designed mg_web to work optimally in this new, modern API server role, while ensuring that it could also support any older-style server-side applications. This provides the best of both worlds, allowing you to evolve and migrate your legacy applications to a modern design at your own pace.
- Achieving new levels of performance with YottaDB: Existing solutions for YottaDB when using the major Web Servers have made use of networked connections between the Web Server and YottaDB. Whilst mg_web still allows such a style of connection, Chris also allows your application to use YottaDB’s ultra-high-performance in-process C API.
Public versus In-house Web Applications 
Most people probably associate web applications with the public Internet where they have become the de-facto standard for application design and delivery. However, from the earliest days of the web, many realised that the very same architecture and technologies could be used to create a highly effective and cost-effective way for designing and delivering private, in-house applications, made available across an organisation’s internal network.
Whilst leveraging the same web technologies, a key difference between a publicly-available web application and a private, locally-networked one is security. A publicly-accessibly web application must be carefully designed to prevent its architectural components from being exploited as a means of gaining unauthorised access to the underlying database: it’s probably the single most important aspect of its design. The scalability of a publicly-accessible web application is also of key importance: you may need multiple, parallel database instances to spread the load in times of heavy demand.
In contrast, a private web application, limited to access across an internal network, is less prone to unauthorised access from outside the organisation (assuming, of course, adequate controls are in place), and a key focus is performance. In this scenario you will have more control over the peak levels of demand for the web service as its user-base will be limited to authorised users within the organisation.
mg_web has been designed with these differences in mind, to allow the optimal use of YottaDB in either, or both, scenarios. As outlined in the previous section above, you can configure mg_web to use:
- Networked access to one or more YottaDB servers, allowing the most secure and scalable configuration. The public-facing part of web application is the web server, and mg_web in networked mode isolates the web server from the database.
- API access YottaDB servers, allows the highest levels of performance, with a closer and more intimate connection between the web server and YottaDB, more suited to an in-house, private application.
mg_web even allows you to mix and match these: it makes sure that you are in control, and you can decide the best and most appropriate mix of performance and security for your particular requirements.
 Legacy Web Applications versus Modern REST-based API Servers
There are many legacy, older, server-side applications web applications. mg_web is the ideal solution to allow you to quickly and easily migrate those legacy applications to a more modern technology that takes advantage of its many benefits, without having to modify much, if any, of core application logic: mg_web runs the M code of those legacy applications!
Applications you build in the future will likely be designed as client-based web applications that make REST requests over HTTPS to get and set YottaDB data. I have created a higher-level platform called mgweb-server that manages setting up and configuring an mg_web-based REST API server. For example, mgweb-server:
- Includes all the basic configuration settings for an Apache-based mg_web system, and all the configuration files for integrating with YottaDB over either a network or API connection.
- Provides a straightforward pattern for defining your REST API “routes” – i.e., defining the REST request patterns that you want to accept, and mapping them to your corresponding handler functions.
- Implements JSON data exchange between client and server. It includes functions that convert bi-directionally between JSON and YottaDB local variables (process-private hierarchical key-value data). Your application logic can simply manipulate local variable (sub)trees, and mgweb-server will convert your local variable to and from JSON.
- Includes APIs for securely storing and authenticating user passwords.
- Includes APIs for creating, authenticating, decoding and modifying JSON Web Tokens (JWTs). Modern REST-based API services increasingly use JWTs as their preferred means of security, user authentication and state management.
mgweb-server comes in two flavours:
- A pre-built Dockerised version that includes pre-installed and configured instances of the Apache Web Server and YottaDB. This version is not just the quickest and easiest way to try out *mgweb-server* and mg_web, but is also a production-ready platform, saving you time and effort. This Dockerised can also be easily re-configured to integrate with any of your existing YottaDB server(s) instead of (or as well as) using the pre-installed version of YottaDB within the Container.
- A “build it yourself” kit that contains all the configuration files and API routine files to customize your own mgweb-server REST API Server platform that uses your own Apache Web Server(s) and your own YottaDB database(s). Before using this flavour, you should first familiarise yourself with mgweb-server using the Dockerised version.
Conclusion 
Between mg_web and mgweb-server, M/Gateway Developments ensure you have all options catered for. You can retain and future-proof your existing legacy of web applications, whilst also being able to use the same underlying mg_web platform with mgweb-server as a polished and easy solution for building your new REST API server-based applications. You can configure your Web Server to work with any number of YottaDB databases, and you can choose between the more flexible networked connections or the high-speed in-process connection between the web server and YottaDB.
Both mg_web and mgweb-server are Apache 2.0 licensed open source software, so there really is no reason not to adopt them for your YottaDB web application development.

About Rob Tweed
Rob Tweed is a software developer, consultant, and teacher who has been active in the M community from long before the days when the M database was unbundled from the M language. Rob and his business partner Chris Munt were pioneers in exploiting emerging web technologies to create rich user interfaces for server-based applications. While software is his vocation, photography is Rob’s avocation, and he is equally passionate about both. The photographs accompanying this post and on the blog page linking to this blog post appear courtesy Rob Tweed. You will find more of his pictures at https://instagram.com/robtweed1955. Thanks, Rob!