
YottaDB Dashboard
Raman Sailopal
Introduction
Users of YottaDB know the benefits of using it. Its technology was established decades ago and it is used in critical medical and financial systems worldwide. Performance overall is “lightning fast” but performance is not simply a binary consideration. A system may perform well at one point in time with a certain workload and not as well at another. As an IT professional, be it a SysAdmin in a traditional IT role or a DevOps engineer in a more modern one, it is important to continuously capture and monitor performance. Monitoring performance allows for the establishing of baselines, including daily, weekly, and monthly cycles, to create trendlines, not only for capacity planning, but also for detecting, diagnosing, and remedying issues. Since human beings interpret visuals well, tools like Prometheus and Grafana make it easier to visualize captured performance data.
Performance Considerations
The causes of performance degradation may be at a system level in terms of CPU or memory that may need scaling but equally it may be at a software/database level in terms of changes in code that may have been released. With modern day DevOps practices adopted along with Continuous Deployment and sometimes multiple releases a day, the monitoring of the effects of software releases is critical, and indeed imperative, to any DevOps process.
Monitoring performance is useful not only for capacity planning and dealing with problems. It can also add business value by identifying times when there is greater demand on a system. Identifying times of greater demand can allow for a better coordination of “targeted” marketing campaigns. For example, if monitoring were to detect a spike in activity from college towns on the first Tuesday each month, that might lead to an insight that perhaps, that is a day when scholarships are disbursed, and students are buying more beers.
YottaDB Performance metrics
At present, there are monitoring capabilities built into YottaDB. The options are as follows:
Additionally there is Gvstat:
All three options provide valuable information such as global sets, gets and kills but the information is somewhat “one dimensional” when viewed and more suited to consumption by software than by humans, e.g:
BTD:124,CAT:221,CFE:0,CFS:0,CFT:0,CFavg:0,CFsigma:0,CFvar:,CQS:0,CQT:0,CQavg:0,CQsigma:0,CQvar:,CTN:199,CYS:0,CYT:0,CYavg:0,CYsigma:0,CYvar:,DEX:0,DFL:2,DFS:1,DRD:17,DTA:60,DWT:124,GET:345,JBB:23192,JEX:0,JFB:286720,JFL:2,JFS:7,JFW:70,JRE:1,JRI:0,JRL:198,JRO:4,JRP:5,KIL:1,LKF:0,LKS:2,LKfrate:0,NBR:1627,NBW:159,NR0:0,NR1:0,NR2:0,NR3:0,NTR:555,NTW:199,ORD:144,QRY:0,SET:197,TBR:0,TBW:0,TC0:0,TC1:0,TC2:0,TC3:0,TC4:0,TR0:0,TR1:0,TR2:0,TR3:0,TR4:0,TRB:0,TTR:0,TTW:0,ZPR:1,ZTR:0
Further details about these metrics can be found here in the YottaDB documentation.
Enhancing Usability
In order to translate this information into a format that better allows trend analysis, we need to be able to graph the data against time. This is where YottaDB-dashboard can help.
YottaDB-dashboard utilizes the following technology stack:
- Grafana – An open source interactive metrics visualization tool.
- Prometheus – An open source metrics querying tool that integrates with Grafana.
- YDBGvstat (referenced earlier)
Utilizing YDBGvstat, YottaDB-dashboard runs an “exporter” presenting the YottaDB metrics periodically via a web server process. Taking an example YottaDB SET metric, the web server process will present data in the example form:
# HELP SET_pit Number of SET operations (TP and non-TP)
# TYPE SET_pit gauge
SET_pit{Process="Yottadb_Stats"} 197.0
This data is then “consumed” by Prometheus, interpreted, and then presented to Grafana via a Prometheus plugin.
Setting Up
- Install Grafana – https://grafana.com/docs/grafana/latest/installation/ – or from your Linux distribution’s package manager, if available.
- Install Prometheus – https://prometheus.io/docs/prometheus/latest/installation/ – or, like Grafana, from your Linux distribution’s package manager.
- Run the YottaDB metrics “exporter” by following the instructions at https://github.com/RamSailopal/YottaDB-dashboard/blob/main/README.md
- Add the extract found at https://raw.githubusercontent.com/RamSailopal/YottaDB-dashboard/main/prometheus.yml to the prometheus.yml config file in /etc/prometheus. Change the IP address and port to the address/port of the server where the “exporter” is running accordingly.
- Start Prometheus.
- Start Grafana and log into the web interface (default port is 3000, default username and password is admin/admin).
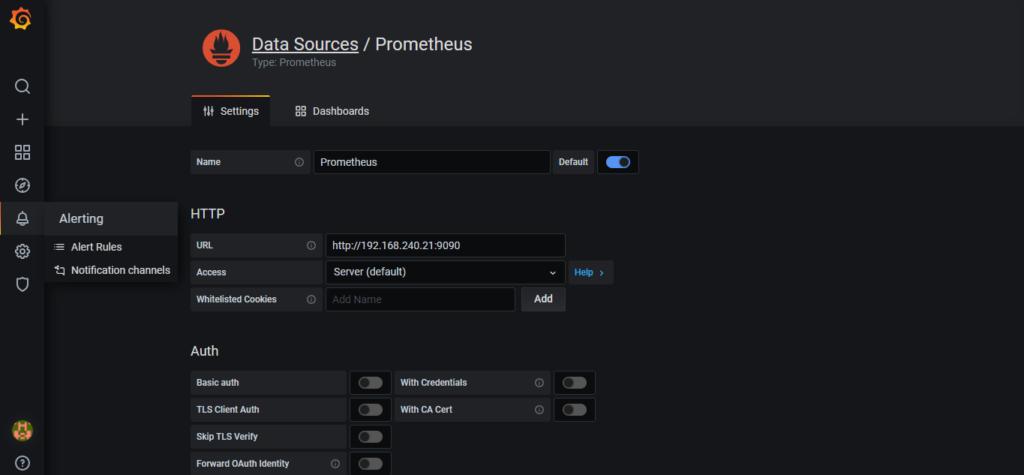
- Click on the cog icon on the left hand side representing configuration, then Data Sources and Add Data Source. Select the Prometheus data source. Name it and then enter the URL. Click Save and Test to ensure it is working.
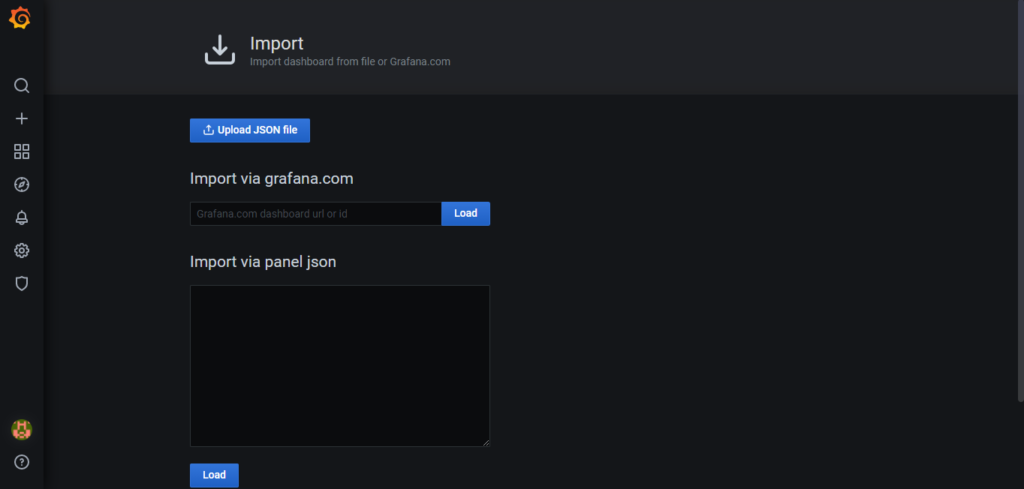
- Click on the four square boxes icon on the left hand side representing Dashboards. Click Manage and then Import. Paste the JSON found here – https://raw.githubusercontent.com/RamSailopal/yotta-dashboard/main/examples/Yottadb-grafana.json to the json panel. Click Load.
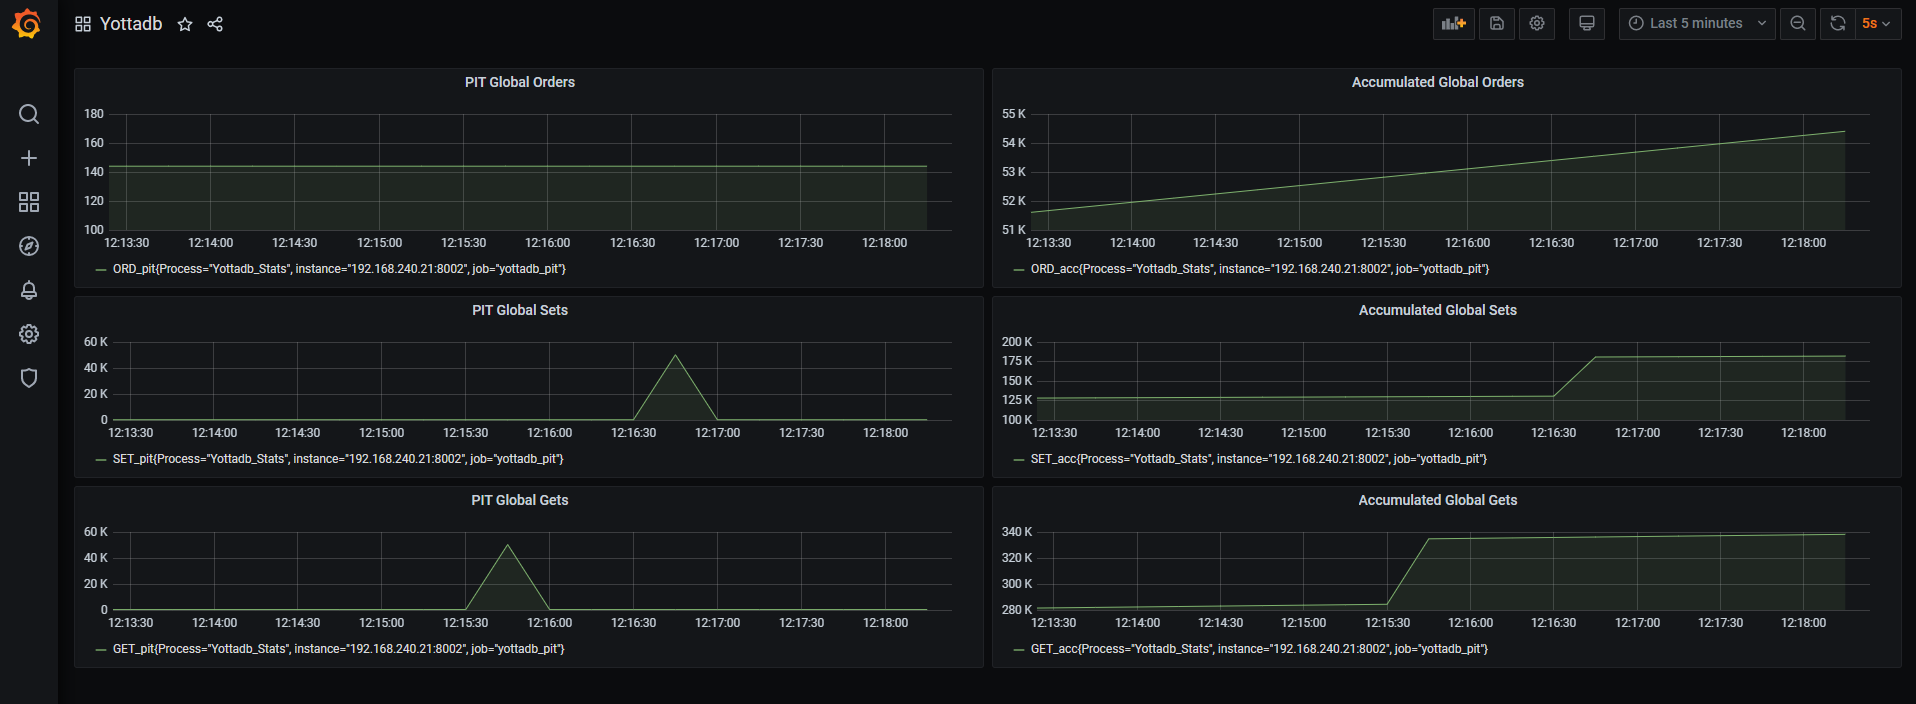
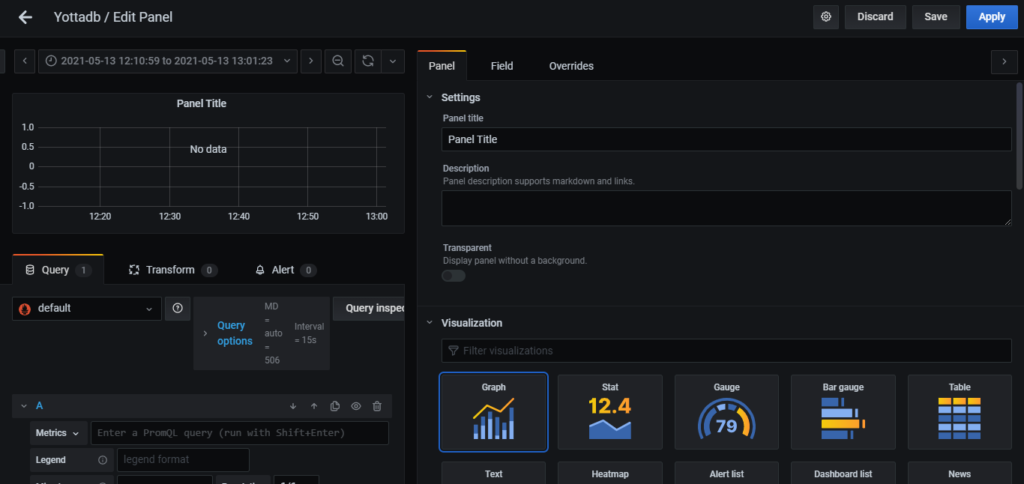
- A dashboard will then be created showing Orders, Sets and Gets metrics. To add further metrics, click on the add panel icon, then click the Metrics “drop down” option in the Query section, ensuring that Prometheus is selected as the data source. All the metrics exported from YottaDB should now appear for selection to chart in a panel.
The Grafana/Prometheus technology stack, be it on physical servers or containers, can further be harnessed to view memory/CPU consumption along-side software metrics as discussed earlier. Additionally, it can be used to monitor database size. System metrics relevant to YottaDB are available as YottaDB-dashboard metrics. The technology stack can also be further added to, by incorporating Grafana Promtail and Loki components to view and interrogate YottaDB system logs. Anybody looking for further information can visit the YottaDB-dashboard Wiki.
Conclusion
YottaDB has open source at its core. This embracing of open source, allows it to be integrated with other open source tools to further extend its capabilities and benefit a wider range of users operating in different areas of IT operations.
The YottaDB-dashboard also has tools and information to help you provision a virtual machine with the YottaDB + Prometheus + Grafana stack using Ansible and Vagrant.
About Raman Sailopal
 I am a professional with over 20 years of experience working in the IT industry. I reside in Birmingham, UK (hence the Birmingham themed pictures). My very first corporate interaction with IT involved using M technology within the UK medical sector and although my journey with IT has seen me follow paths involving Linux, Cloud architecture and open source, I have always held a fond regard for M based technologies and their potential with critical IT systems. Working with YottaDB allows me to combine these passions and contribute to the growth of both M and open source.
Images Used:
[1] Young man taking the Peaky Blinders soundtrack album out of his vinyl collection. Photo by Jonas Leupe.
[2] The Canal House, Birmingham. Photo by Danilo D’Agostino.
Screenshots courtesy Raman Sailopal.
Published on June 21, 2021