What's New

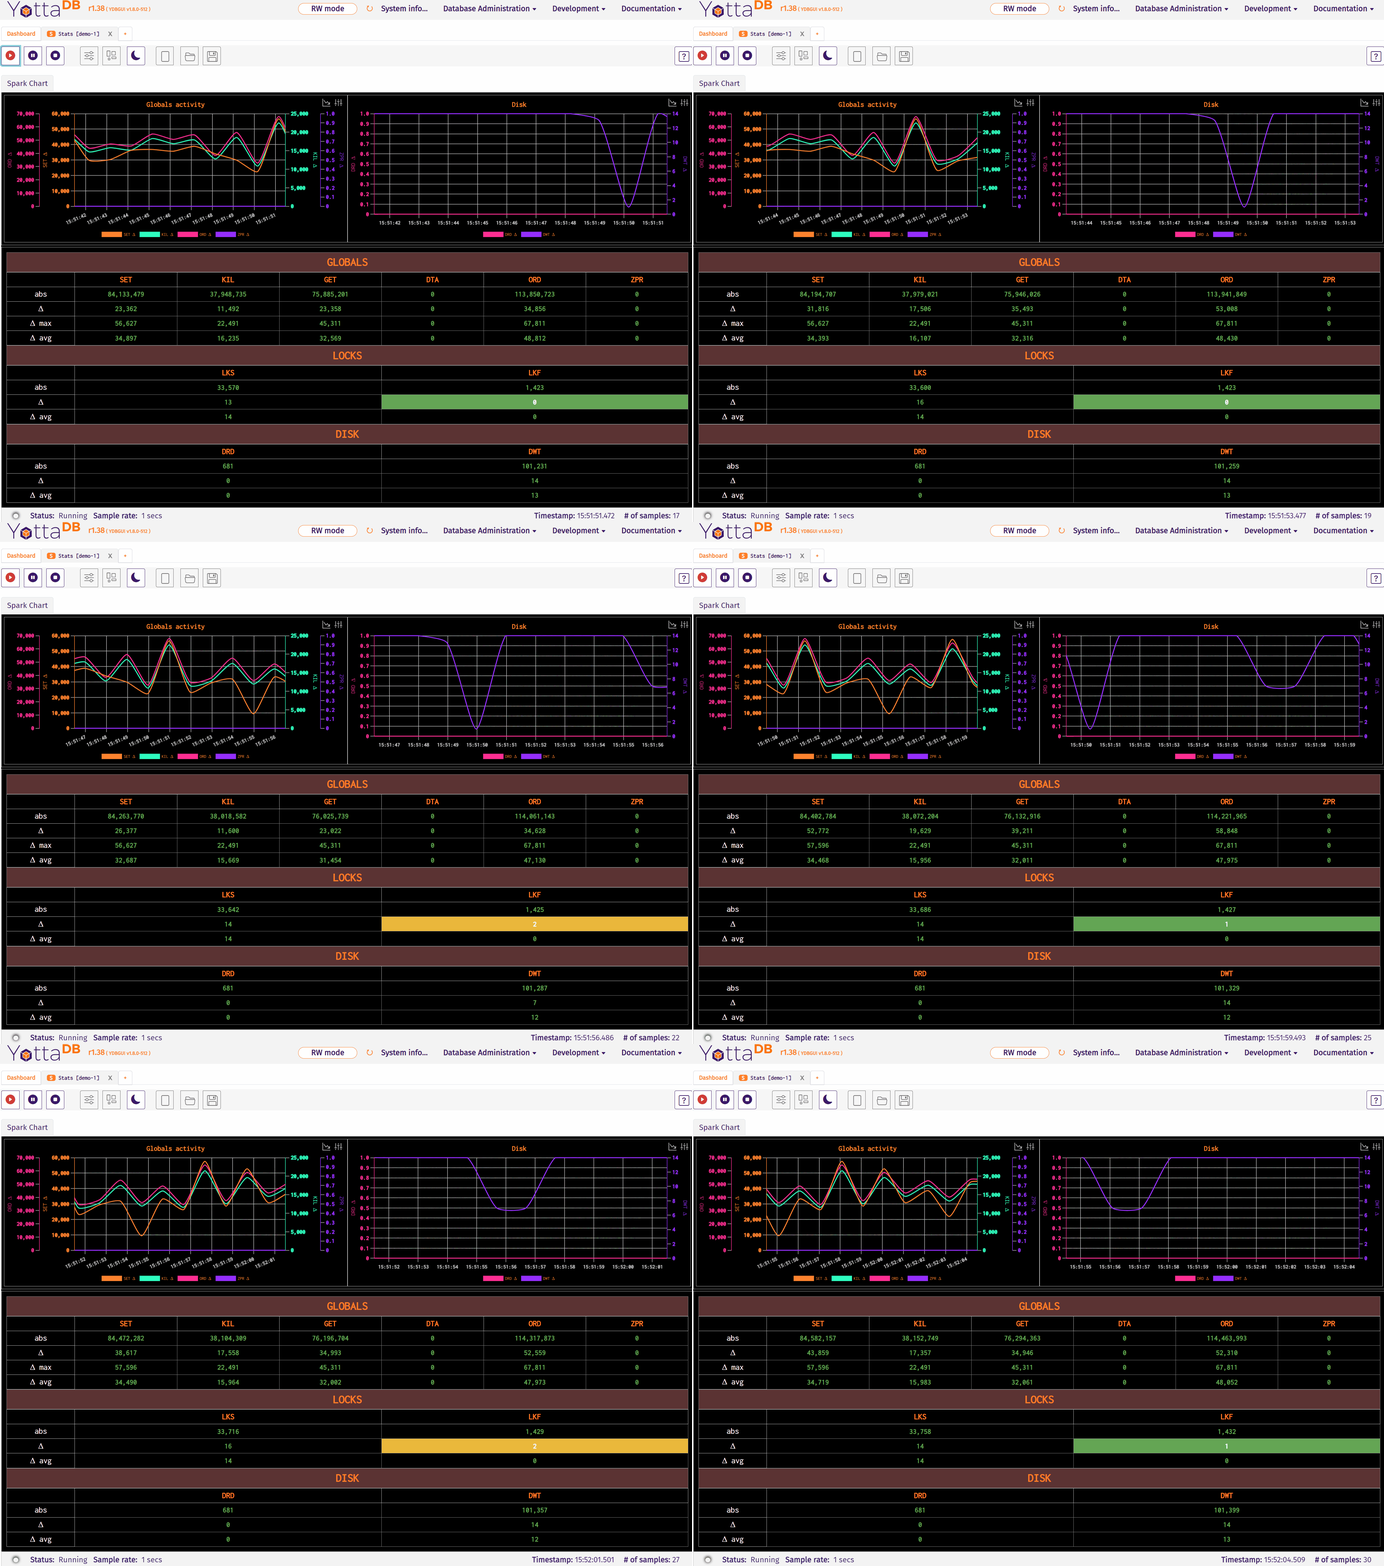
Graphical Monitoring of Statistics Shared by Processes
You can now use the YottaaDB GUI to graphically monitor statistics shared by processes. See how at Graphical Monitoring of Statistics Shared by Processes.
Published on January 24, 2024

